Forecast provides a comprehensive listing of U. S. and Canadian project starts – both historic data and the projected starts for the next 24 months. You can filter the data using a range of filters, including date range, US and Canadian location, category, and development type. Once you get the data you want, you export the data graph as an image and the data table in Excel format.
Note: See Understanding construction startsConstruction Starts for information about the data in Forecast.
This section contains the following topics:
| Table of Contents | ||
|---|---|---|
|
| Anchor | ||||
|---|---|---|---|---|
|
Using menu options
The options on the main page let you export the data, save data views, select categories and access the construction industry reporting.
Exporting the data
To export the data currently displayed in the window,
- click Export and select either JPG (image file) or PDF (document file). Once compiled and formatted, you can download the file to your device.
Running a saved search
To run a saved Forecast search,
- click the search to run from the list in the Saved Searches menu on the upper-right side of the window.
Result: The search runs and the data in the window refreshes with the results.
| Anchor | ||||
|---|---|---|---|---|
|
The Category menu at the right side of the window displays the categories included in the data view:

To select which data categories are used for filtering the data,
- click on the category name in the menu to show or hide the category. For more information about applying filters to the data, see Using the Filters menu.
Construction reporting
You can access the quarterly and monthly construction reports using the links below the graph:
![]()
- The ConstructConnect Quarterly Construction Starts & Forecast Report covers the key construction trends in the U.S. and Canada and provides details behind the forecasts for the stated period.
- The ConstructConnect Monthly Construction Industry Snapshot Report details a monthly in-depth look at the state of the construction industry.
Working with the data graph
The data graph displays the project data by value and date range for each of the categories. You can adjust the date range directly on the graph or by using the Filters menu. For more information, see Using the Filters menu.
When using the data graph,
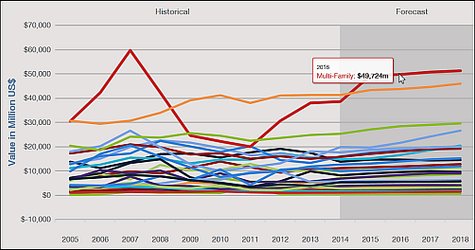
- the historical and forecast data is distinguished by different background shading: the historical data shading is lighter and on the left and forecast is shaded darker and on the right.
- Using the Filters menu, you can change the display to only show historical data.
- each category is color coded to the Category legend on the right side of the window, as described above in Selecting the categories to view.
Selecting the dashboard data view
You can select to view the data on the dashboard as a bar or line graph, or percentage chart by clicking on the icon at the top of the section:
![]()
Moving from left to right, the options are:
- Bar chart
- Line chart
- Percentage bar chart
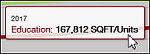
Viewing line details
Hovering over the pivot points of a line displays the year, category, and value for that segment of the line:
| Anchor | ||||
|---|---|---|---|---|
|
Understanding the data graph
The following table describes the different viewing options for the data graph.
| Option | Description |
| Line | The line view displays the data by value and date for each category:
|
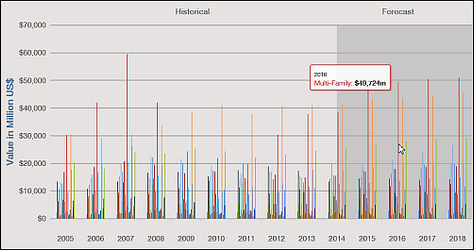
| Bar | The bar view displays each of the selected categories grouped together by year:
|
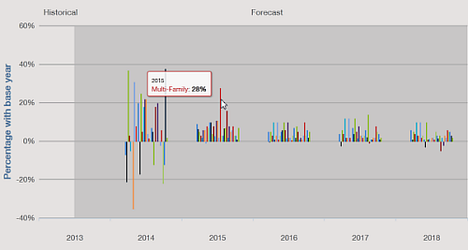
| Percentage | The percentage with base year view displays the percentage change for each category from the selected base year: Note: The base year is selected from the selection on the Filters menu. |
Working with the data table
The data table is below the data graph and displays project value by year according to the options selected in the Filters menu. You can select to match project value either by category or geography, see the percentage of value change over time, and export the data in an Excel spreadsheet.
The following table describes the features of the data table.
| Option | Description |
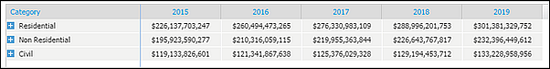
| Category view | The Category view displays project values according to the categories selected in the Filters menu:
|
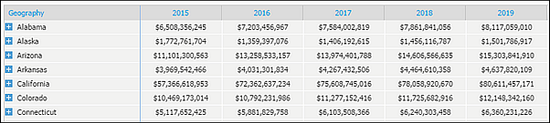
| Geography view | The Geography view displays project value by location:
|
| Exporting the data | To export the data currently displayed in the table,
|
| Showing change by percentage | You can show the percent change in project value year-over-year for the time period selected. To show percentage change,
|
Using the Filters menu
The Filters menu on the left side of the window lets you refine the data using a variety of options, including date, geography, measurement, and development type. Each time you select a filtering option, the data in both the graphical view and the data table refresh with your selections:

Tip: You can also save any of your filter selections for future use. This lets you apply your own customized filtering to the data each time you log in to your account. For more information about this feature, see Working with your saved Forecast searches.
The following table describes the options you can select for using the Filters menu.
| Option | Description | ||||||||||||||
| Data Set | You can select to include either historical data or both historical and forecast data in your results:
Note: This selection changes the options in the following sections:
| ||||||||||||||
| Period | You can select from three time periods to filter data. Each selection can be further refined using the year slider bar in the menu.
You can also use the slider bar to further refine your results by year range on either end. | ||||||||||||||
| Geography | The Geography filter lets you select data for either the USA or Canada.
The following table describes your options for filtering the data by geography.
| ||||||||||||||
| Category | The Category filter lets you refine the data using selected categories. Note that the currently applied categories are displayed in the Category menu on the right side of the window. To filter by category,
| ||||||||||||||
| Measurement | Select from one of the following measurements to filter the results.
| ||||||||||||||
| Development Type | Select from the type of projects to be displayed in the results depending on the value selected in the Data Set section.
Notes:
|
Working with your saved Forecast searches
You can save, rename and run any of your filter sets as a saved Forecast search.
Saving your applied filters as a new Forecast search
To save your applied filters,
- once you have the filter settings you want to save using the Filters menu, click Save Search.
- In the Save Search menu, enter the name for the search and then click Save.
Result: The filter set is saved and is accessible as a search from the Saved Searches menu on the upper-right side of the window.
Loading a saved view
Loading a saved view applies previously saved filters to the current search results.
To load a saved view,
- click Saved Searches at the top of the menu and then select the saved search you want to use.
Result: The window refreshes with the results.
Renaming saved views
To rename a saved view,
- load a saved view in the window and make your changes to how the data is filtered.
- Click Save Search > Save As.
- In the Save Search menu, enter the name for the view and then click Save.
Result: The filter is saved with your changes.