The Pulse Usage Table displays the statistics for the Insight users in your company, both for teams and for individual users.
This section contains the following information:
| Table of Contents |
|---|
| Anchor | ||||
|---|---|---|---|---|
|
| Anchor | ||||
|---|---|---|---|---|
|
Tip: To access the Usage Table from the Dashboard, click the tab at the top left of the window:
Understanding the Usage Table content and layout
The two options for viewing Pulse activity in the Usage Table are Team View and User View, as described in the following table.
Team View | Displays the teams and aggregate team totals. This is the default view when you first access Pulse. Tip: To view the statistics for individual users, click on the team name to expand the team list in the User View window. |
User View | Displays the individual users and associated user totals in a team. To access this window, click on on the name for a team. You can only display the users and totals for a single team at one time. Tip: To return to the Team View window while in User View, click Return to Team View from the menu bar at the top of the window. |
Exporting the metrics
To export the contents of the Team View window as a formatted Excel spreadsheet,
- click Export > Export to Excel in the top right of the menu bar.
Result: The export runs and a message is displayed when your export is ready to download.
Modifying the table layout
To modify the table layout, click at the top of each column to
select which columns to display in the window.
sort the columns in ascending or descending order.
click and drag a column into a different order in the window.
Additionally, you can use the padlock icon to lock or unlock the layout of a table.
Selecting the team view level (Team View only)
Pulse teams are created in descending order by levels in the Manage Teams menu, with the top team as Level 1 and all other teams descending incrementally, such as Level 2, Level 3, and so on. Each team is a separate entity and has its own statistics. To view individual data for a team, you must change the team view level to the corresponding level of the team. When viewing team data, you can see team names, user names and team parents.
You can change the team level view using the Team View menu:
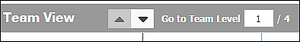
Both the arrows and the Go To Team Level field can be used to change the levels displayed.
To change the level, either
- click the up or down arrow or
- enter the number for the level you want in the number field and press Enter.
Notes:
- The number field always displays the current level selected.
- The filtering options in the Filters menu match the level displayed in the Team View window.
Using the Filters menu
The Filters menu lets you select specific users to see only their activity in the results:

The user names that are shown in the Filters menu mirror exactly the users that are currently displayed in the Team View window. This is controlled by the level selected.
To change the level and display a different set of teams and users in both the Team View window and Filters menu,
- select the desired level using the options on the menu bar. For more information, see Selecting the team level to view.
The following table describes how you can use the Filter menu to filter your results in the Team View window.
If you want to... | Then... |
see the users assigned to a team | click the plus + sign next to a team name. |
see all unassigned users | click the plus + sign next Unassigned. |
filter by user | expand the team and then check the box next to the user. click Apply. Result: The Team View menu refreshes with the results. |
filter by all users in a team | check the box next to the team name. click Apply. Result: The Team View menu refreshes with the results. |
search for users or teams | enter the team or user name in the search box and press Enter. Result: The Team View menu refreshes with the results. |
Understanding Usage Table Team and User View information
The Usage Table reports statistics for both teams and individual team members. The information at the beginning of the table identifies what is being reported on, as described in the following table.
Field | Description |
For Team View: | |
Team | The name of the team. Notes: Users that are not part of a team are in the Unassigned team. To display the team names in the User column, click on the + sign next to the team name |
User | The users included in the team. |
Team Parent | The top level team. This is the default team. |
Team Start | The dates the team is active. An Active means that the team is currently active. |
Team End | |
For User View: | |
User | The name of the user. |
Team | The name of the team to which the user is assigned. |
User Assigned | The dates that the users is added and removed from the team. |
User Unassigned | |
Understanding Insight totals on the Usage Table
The Usage Table displays the activity totals for the Insight users in your company, depending on the view selected.
| Panel | ||||
|---|---|---|---|---|
| ||||
Note: For dates prior to 2/1/2016, not all metrics in the Pulse Usage Table are available and certain metrics are elevated due to tracking revisions. The metrics available prior to 2/1/2016 include: Insight Logins, Leads Logins, Analyze Logins, Forecast Logins, Project Views, Company Views, Document Views, and Document Downloads. |
The following table describes the Insight totals for the users in your company as displayed in the Usage Table.
Field | Description |
Insight Logins | The cumulative number of logins to the Insight platform. |
| Leads Logins | Total number of logins to Leads, counted when the module is accessed from the left-hand navigation menu. Not counted is accessing Leads by clicking to access a project or company in the Analyze module. Note that logins are limited to one login per session per calendar day. |
Analyze Logins | Total number of logins to Analyze, counted when the module is accessed from the left-hand navigation menu. Note that logins are limited to one login per session per calendar day. |
Forecast Logins | Total number of logins to Forecast, counted when the module is accessed from the left-hand navigation menu. Note that logins are limited to one login per session per calendar day. |
Project Views | Total individual views of project details pages. Included actions are viewing a project details page from Leads and Analyze search result, from email alerts, exports or CRM feed and from Document Center. Duplicate views are counted. |
| Unique Project Views | Total individual views of project details pages for the date range requested. Included actions are viewing a project details page from Leads and Analyze search result, from email alerts, exports or CRM feeds and from Document Center. Duplicate views are not counted. Projects viewed multiple times, per date range, are counted as a Unique Project View. |
| Projects Tracked | Total number of projects marked as tracked in Leads. Included actions are both tracking and un-tracking projects. |
Leads Searches Run | Total number of new Leads searches run. Included are ad-hoc searches, such as searching by keyword and then clicking the spyglass icon from a search results page or from the Snapshot window. Note that only applying filters is not counted. |
Analyze Searches Run | Total number of new Analyze searches run. Included are ad-hoc searches, such as searching by keyword and then clicking the spyglass icon from a search results page or from the Snapshot window. Note that only applying filters is not counted. |
Leads Saved Searches Run | Total number of saved Leads searches run. This includes both individual and assigned saved searches. Valid actions include: Selecting a search from the load search menu. Clicking on any number/count from the Snapshot grid. Clicking on any search name from the Snapshot Saved Search menu. Clicking on a state from the Snapshot Geo map. Clicking on a search name from the Leads section of the Manage Searches page. |
Analyze Saved Searches Run | Total number of saved Analyze searches run. This includes both individual and assigned saved searches. Valid actions include: Selecting a search from the load search menu. Selecting an Analyze search from the Load Search menu. |
Project Marked for CRM | The number of individual projects that have been tagged for CRM integration for the date range selected. This includes all projects from a saved search that are flagged for CRM integration. For example, if a saved search is flagged for CRM integration, and a new project meets the saved search criteria within the date range selected, it is included for CRM integration and counted. |
Company Views | Total cumulative views of company details pages. Valid actions include: Viewing a company details page from Leads and/or Analyze search results, from email alerts, from exports or CRM (valid only with a login to Insight). Duplicate view are counted. |
Unique Company Views | Total individual views of company details pages. Valid actions include: Viewing a company details page from Leads and/or Analyze search results, from email alerts, from exports or CRM (valid only with a login to Insight). Duplicate views are not counted. |
Companies Tracked | Total number of companies marked as tracked. Included actions are both tracking and un-tracking companies. |
Project Document Views | Total number of project documents viewed. |
Project Document Downloads | The total number of pages of project documents exported. |
Leads Project List Exports | Total number of Leads project search results lists exported. |
Leads Company List Exports | Total number of Leads company search results lists exported. |
Analyze Project List Exports | Total number of Analyze project search results lists exported. |
Analyze Company List Exports | Total number of Analyze company search results lists exported. |
Emails Sent | Total number of emails generated from Leads. This can include emails for saved search, Watch List project alerts and bid notification alerts. |
Emails Opened | Total number of emails generated from Leads that have been opened by the recipient. Note: The totals for this metric depend on the users' email viewer and image viewing permissions. |