Viewing and modifying the search criteria
| Anchor | ||||
|---|---|---|---|---|
|
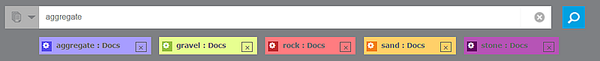
The criteria used for the current search are displayed directly below the search bar tile:
You can modify your search criteria by adding or removing terms from the menu. For more information about editing your search, see Searching in Analyze.
Repositioning the data tiles
You can position the tiles in the window to any location that you select. The tiles remain locked in place, including when you log out and log back in, until you change them again.
To reposition the data tiles,
- Click Edit on the View/Edit button at the top of the window (the button is activated when the color is blue):
![]()
- Click on the header for any tile and drag it into the desired position. Resize the tile by pulling on the lower right corner of the tile.
- Click View to lock the tile into the new position (the button is active when the color is blue):
![]()
Note: For information about setting the data tiles to be displayed, see Selecting default Analyze tiles.
Switching between total project count and total value
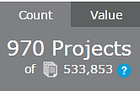
You can view the total count of projects in Analyze either by total project count or by total project value. This applies to all available projects in Analyze, both before and after a search. Each time you change the value type, the project information in each of the data tiles changes to the new type. Project Count is the default setting.
To switch between project count and total value,
- use the menu at the top right of the window:
Running, editing and assigning searches
You can run, edit and assign any of your saved Analyze and Insight searches using the options at the top of the window:
![]()
The following table describes how you can work with searches in Analyze.
| Option | Description |
| Load Search | To load and run a saved search,
|
| Save Search | To save the parameters of the current search,
|
| Load Insight Search | Click to select from one of your saved Leads searches to run. Note: For more information, see Working with saved project searchesSaved Project Searches. |
| Assign Search | Click to assign the current search to yourself or to others in your work group. For more information, see Assigning a search. |
Using export data options
The Analyze export feature lets you select the type of export you can perform, as described in the following table.
| Option | Description | ||||||||
| Custom Export | Click to open the Export Analyze Data window where you can customized your report.
| ||||||||
| Export All Charts | Select to export the data of each tile currently selected as a paginated PDF document. | ||||||||
| Export All Date (xls) | Select to export the results as a formatted Excel spreadsheet. Each data tile is displayed in a separate Excel tab. Also included are the top 20 projects or companies selected from the matching results at the bottom of the results window. |
Common data tile features
Each data tile contains features that are common to each tile, as described in the following table.
| Feature | Description
| ||||||
| Clearing edit options | Each data tile has an edit option that lets you apply filters to your search results. Each time you select a filtering option, the current data tile and all other data tiles refresh with the revised data.
| ||||||
| Exporting results | You can export the results of a single data tile using the export feature on the tile. Once you select an option, the selected export type automatically downloads to your device. Note that the export format may not be available for each tile.
| ||||||
| Sorting data tables | Most of the columns in data tile tables can be sorted by clicking on the column headers, both in ascending and descending order. | ||||||
| Selecting the data view | Most data tiles let you select from a variety of options for viewing the data. To change the data display, click on the icon at the top of the data tile. | ||||||
| Rolling up data tiles | You can roll up the data tiles so that only the top bar is visible.
|
Projects Over Time
The Projects Over Time section displays project counts by search term for a set period of time. You can use the menu to narrow the selected date range. Click the icons at the top of the tile to display the results as a line, graph, bubble graph and table.
Editing the date range
To edit the date range,
- Click Edit at the top of the section.Use the Dates Showing option to select the date range:
- Click in the calendar boxes to select a beginning or ending date, or both.
- Select the reporting frequency for your results, which can be weekly, monthly, quarterly or yearly. Note that you can also select to show either total project count or total project value.
- Click apply selection when you are done.
Using menu options
The following table describes your options for viewing the Projects Over Time menu.
| View | Description | ||||||
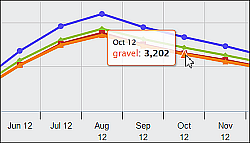
| Line | The line view displays the number of projects in relation to the selected date range for each search term. Each search term is represented by a separate color-coded lines:
Each pivot point on the line represents a change in the project count for that search term. Hovering over a pivot point displays the date and project counts for the term. | ||||||
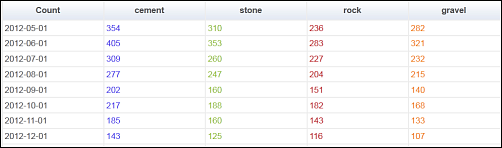
| Grid | The grid view lists the dates and matching project counts in table format:
You can sort both the date and project count columns by clicking on the headings at the top of the menu. | ||||||
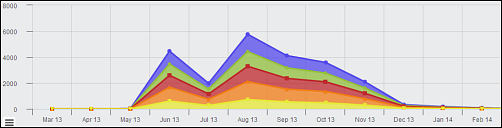
| Stacked area | The stacked area view uses color to add a dimension of volume for each search term:
Each pivot point on the line represents a change in the project count for that search term. Hovering over a pivot point displays the date and project counts for the term. | ||||||
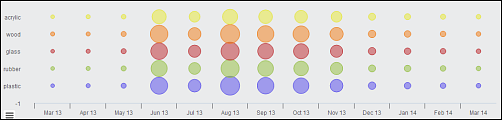
| Bubble | The bubble view gives you a visual indication of the volume represented for each of your search terms:
|
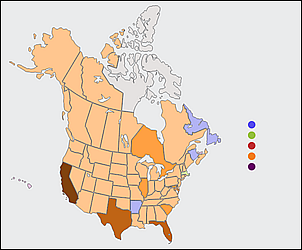
Project Location
The Project Location section displays the number of projects matching your search terms according to state or province. Click the icons at the top of the tile to display the results as a color-coded map, column, and grid.
Editing your results
To edit the locations returned in your search,
- click Edit at the top of the section.
- Click to expand the menu and then select the desired locations. You can also select to show either total project count or total project value.
- Click apply selection when you are done.
Using menu options
The following table describes your options for viewing and refining your results using the Project Location menu.
| View | Description | ||||||
| Map | You can use the interactive color coded map to refine your results by location:
The shading indicates the number of projects found in each state or province: lighter shading equals fewer projects and darker shading equals more projects.
To the right of the map are colored circles that match the coloring for the search term. Hovering over a circle displays the name for the term. Clicking a circle removes or adds the term to the results. Note that you must keep at least one search term in the menu. Using the menu To filter results by location,
| ||||||
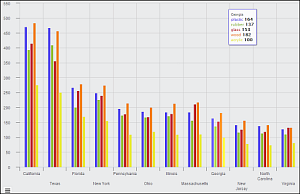
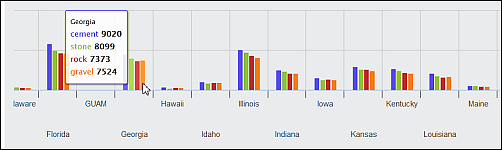
| Column | The column view displays project counts by location for each search term:
Hovering over a column displays the count of each search term: Using the menu To filter results by location,
| ||||||
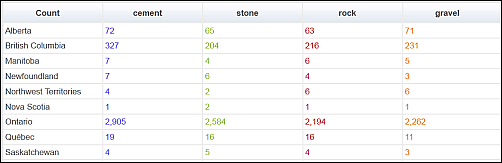
| Grid | The grid view displays project counts by location for each search term:
Each search term is represented by a separate column. Clicking on a column header resorts the column in alpha-numeric order. Using the menu To filter your results by project location,
|
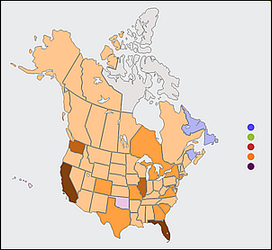
Company Location
The Company Location section displays the number of companies by state or province that match your search terms. Click the icons at the top of the tile to display the results as a color coded map, a column, and a grid.
Editing your results
To edit the locations returned in your search,
- click Edit at the top of the section.
- Click to expand the menu and then select the desired locations. You can also select to show either total project count or total project value.
- Click apply selection when you are done.
Using menu options
The following table describes your options for viewing and refining your results using the Company Location menu.
| View | Description | ||||||
| Map | The map displays the geographical locations of the companies by volume that participate in projects matching your search terms:
The shading indicates the number of companies found in each state or province: the darker the shading the greater number of companies found that match the search terms. Hovering over a location lets you see the number of companies. Using the menu To filter your results by location,
| ||||||
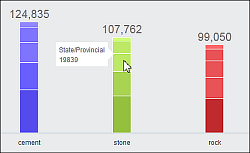
| Column | The column view displays the number of companies for each location that have projects matching your search terms:
Hovering over the bars lets you see the number of companies for each location. Hovering over the search term name highlights the search term results in the menu. Using the menu To filter results by location,
| ||||||
| Grid | The grid view lets you see the number of companies by location for each search term:
Each search term is represented by a separate column.
Using the menu To filter your results by location,
Note: The default view displays the list in descending order by date. You can resort the list by clicking on the Count or Query column headers.
|
Company Role
The Company Role section displays the number and type of companies matching each of your search terms. You can choose from a variety of options for viewing the results.
Editing your results
To edit the company roles returned in your search,
- click Edit at the top of the section.
- Click to expand the menu and then select the desired roles. You can also select to show either total project count or total project value.
- Click apply selection when you are done.
Using menu options
The following table describes your options for viewing and refining your results using the Company Roles menu.
| View | Description | ||||||
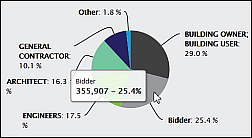
| Pie | The pie view displays the role and the project count and related percentages of the role for projects returned:
Each section of the pie represents a separate role or group of roles. Hovering your mouse over the sections displays the role name, the project count and percentage of the total for the role. Using the menu To filter your results by role,
| ||||||
| Stacked | The stacked view displays a breakdown of company roles for each of your search term:
Each bar represents a separate search term, and the different segments in the bars represent the roles and corresponding project count for the role. Hovering your mouse over the bars displays the role and project count for the search term associated with that role. Using the menu To filter your results by role,
| ||||||
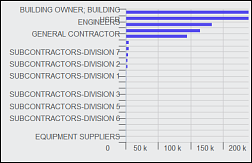
| Column | The column view displays the role name and corresponding project count for each of your search terms:
Each group of bars represents a role and the individual bars in a group represent a separate search term. Hovering your mouse over the bars displays the role and project count for each search term associated with that role. Using the menu To filter your results by role,
| ||||||
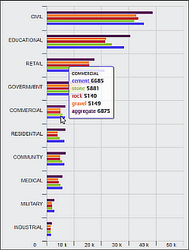
| Bar | The bar view displays the role name and corresponding project count by for each of your search terms:
Each group of bars represents a role and the individual bars in a group represent a separate search term. Hovering your mouse over the bars displays the role and project count for each search term associated with that role. Using the menu To filter your results by role,
| ||||||
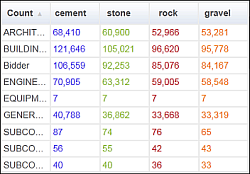
| Grid | The grid view displays the role name and corresponding project count for each of your search terms:
In this menu: Each search term is represented by a separate column.
Using the menu To filter your results by role,
|
Project Stage
The Project Stage section displays the projects matching your search terms by Planning, Bidding, Post-Bid, and Miscellaneous stages. You can choose from a variety of options for viewing the results.
Editing your results
To edit the project stages returned in your search,
- click Edit at the top of the section.
- Click to expand the menu and then click to select the desired stages.
- Click apply selection when you are done.
Note that you can also select to show either total project count or total project value.
Using menu options
The following table describes your options for viewing and refining your results using the Project Stage menu.
| View | Description | ||||||
| Stacked | The stacked view displays a breakdown of stages for each search term:
Each bar represents a separate search term and the different segments in the bars represent the stages for the term. Hovering your mouse over the bars displays the stages and project count for the search term. Using the menu To filter your results by stage,
| ||||||
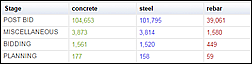
| Grid | The grid view displays the project count by search term for each stage:
Each search term is represented by a separate column. Each row represents a different stage.
Using the menu To filter your results by stage,
| ||||||
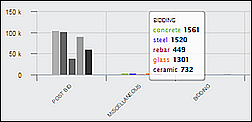
| Column | The column and bar view displays the number of projects for each stage: 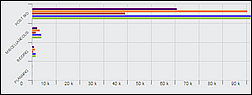
Each group of bars represent a stage and the individual bars in a group represent different search terms. Hovering your mouse over the bars displays the search term and corresponding project count for the stage. Using the menu To filter your results by stage,
| ||||||
| Bar | |||||||
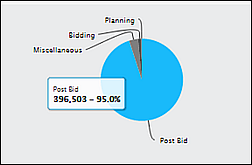
| Pie | The pie view displays the count and percentage of projects for each stage:
Each section of the pie represents a separate stage. Hovering your mouse over the sections displays the stage name, the project count and percentage of the total for the stage. Using the menu To filter by stage,
|
Project Ownership
The Project Ownership section displays the number of projects matching your search terms grouped into city, state, county, private, and federal ownership. You can choose from a variety of options for viewing the results.
Editing your results
To edit ownership types returned in your results,
- click Edit at the top of the section.
- Select the ownership type. You can also select to show either total project count or total project value.
- Click apply selection when you are done.
Using menu options
The following table describes your options for viewing and refining your results using the Project Ownership menu.
| View | Description | ||||||
| Stacked | The stacked view displays a breakdown of project ownership for each search term: Each bar represents a separate search term and the different segments in the bars represent the ownership types for the term. Hovering your mouse over the bars displays the ownership type and project count for the search term. Using the menu To filter by project owner type,
| ||||||
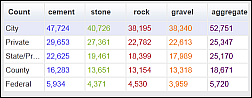
| Grid | The grid view displays the project count by search term for each of the ownership types: Each row represents an ownership type and each column represents a search term.
Using the menu To filter by ownership type,
| ||||||
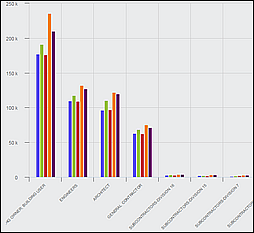
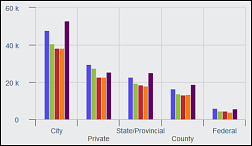
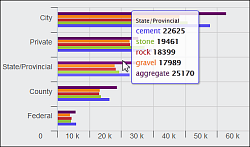
| Column | The column and bar views display the search terms grouped by ownership type ranked according to project count:
Each group of bars represents an owner type and the individual bars in a group represent different search terms. Using the menu To filter by project ownership type,
| ||||||
| Bar | |||||||
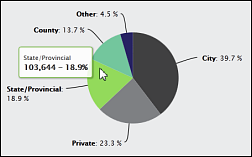
| Pie | The pie view displays the percentage and count of projects for each of the ownership types:
Using the menu To filter by project owner type,
|
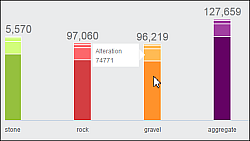
Type of Work
The Type of Work section displays the number of projects in your search results according to work type, which can be alteration, new, addition, addition/alteration and addition. You can choose from a variety of options for viewing the results.
Editing your results
To edit the work types returned in your results,
- click Edit at the top of the section.
- Click to expand the menu and then select the desired work types. You can also select to show either total project count or total project value.
- Click apply selection when you are done.
Using menu options
The following table describes your options for viewing and refining your results using the Type of Work menu.
| View | Description | ||||||
| Stacked | The stacked view displays a breakdown of work types for each search term:
Each bar represents a separate search term and the different segments in the bars represent the work types for the term. Hovering your mouse over the bars displays the work type and project count for the search term. Using the menu
| ||||||
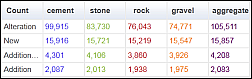
| Grid | The grid view displays the project count by search term for each of the work types: Each row represents a work type and each column represents a search term.
Using the menu To filter your results by work type,
| ||||||
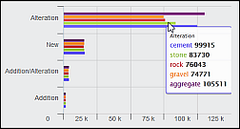
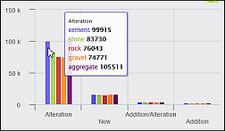
| Column | The column and bar views display the search terms grouped by work type ranked according to project count: Each group of bars represents a work type and the individual bars in a group represent different search terms. Using the menu To filter by work type,
| ||||||
| Bar | |||||||
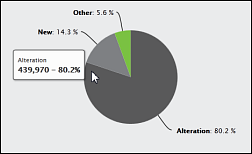
| Pie | The pie view displays the percentage and count of projects for each of the work types:
Using the menu To filter by work type,
|
Project Type
The Project Type menu displays the types of projects for each search term. You can choose from a variety of options for viewing the results.
Editing your results
To edit the project types returned in your results,
- click Edit at the top of the section.
- Click to expand the menu and then select the desired project types and sub-types.
- Click apply selection when you are done.
Note: You can also select to show either total project count or total project value.
Using menu options
The following table describes your options for viewing and refining your results using the Project Type menu.
| View | Description | ||||||
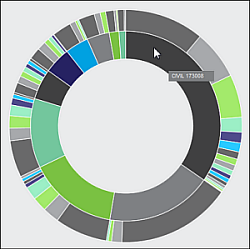
| Donut | The donut view shows the project counts by categories and subcategories:
The inner ring shows categories and the outer ring the subcategories. Hovering your mouse over a section displays the project type and the project count for that type. Using the menu To filter by type,
| ||||||
| Stacked | The stacked view displays a breakdown of category types for each search term: Each bar represents a separate search term, and the different segments in the bars represent the project types. Hovering your mouse over the bars displays the category and project count for the search term. Using the menu To filter your results by project type,
| ||||||
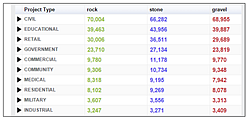
| Grid | The grid view displays the number of projects for each category:
Each row represents a project category and each column represents a search term.
Using the menu To filter your results by project type,
| ||||||
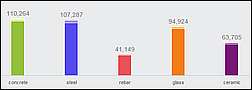
| Column | Both the column and bar views display project counts for your search terms grouped by project type:
Each group of bars represents a project type and the individual bars in a group represent different search terms. Hovering your mouse over the grouped columns displays the project count for each search term. Using the menu You can filter the menu by category and you can see a breakdown for each of the project types, as described in the following table.
|
CSI Divisions
The CSI Divisions section displays the projects matching your search terms listed according to CSI MasterFormat Division Number and project documents that include your keyword. You can view the results as a sunburst or a grid.
Note: For more information about CSI Division Numbers, visit the Construction Specifications Institute website.
Editing your results
To edit the CSI Divisions returned in your results,
- click Edit at the top of the section.
- Click to select the desired CSI numbers to display. You can also select to show either total project count or total project value.
- Click apply selection when you are done.
Using menu options
The following table describes your options for viewing and refining your results using the CSI Divisions menu.
| View | Description | ||||||
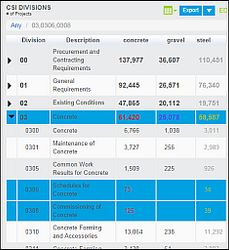
| Grid | The grid view displays your results in table format:
Using the menu To filter your results by CSI number,
| ||||||
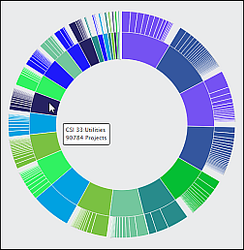
| Sunburst | The sunburst view displays the number of projects found for each CSI number:
The inner ring contains division numbers and the outer ring contains sub-division numbers. Using the menu To filter your results by CSI number,
|
Matching Documents
The Matching Documents section displays the number of projects with matching document types for each of your search terms.
Editing your results
To edit the matching documents returned in your results,
- click Edit at the top of the section.
- Click to select the desired document types.
- Click apply selection when you are done.
Using menu options
The following table describes your options for viewing and refining your results using the Matching Documents menu.
| View | Description | ||||||
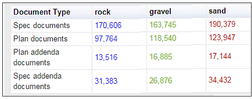
| Grid | The grid view displays the project counts for each search term according to document type:
Each column represents a separate search term and each row a separate document type. Using the menu To filter your results by matching documents.
| ||||||
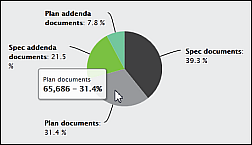
| Pie | The pie view displays the document type and its relative size to the whole:
Hovering your mouse over a section displays the document type, project count and percentage of the document type for the whole. Using the menu To filter your results by document type,
|
Project Value
The Project Value section groups the projects returned in your search into increments of value. You can choose to view the results as a column, bar or grid.
Editing your results
To edit the value range and specify project values returned in your results,
- click Edit at the top of the section.
- Enter a minimum or maximum value, or both.
- Click apply selection when you are done.
Using menu options
The following table describes your options for viewing and refining your results using the CSI Divisions menu.
| View | Description | ||||||
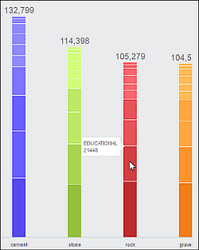
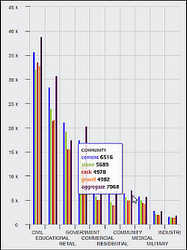
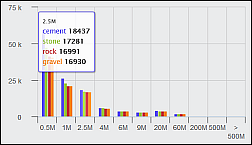
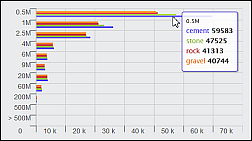
| Column | The column view displays the number of projects for each search term grouped by value range:
For the data displayed: The vertical axis represent project counts in thousands. The horizontal axis represents value in increments of a half million dollars. Each colored column in a group represents a separate search term.
Using the menu To filter your results by value,
| ||||||
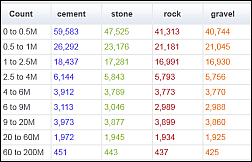
| Grid | The grid view displays the project count for each of your search terms ranked according to value:
The first column represents value ranges and each subsequent column represents search terms.
Using the menu To filter your results by value,
| ||||||
| Bar | The bar view displays your search terms grouped by value and project count:
Each group of bars represents a value range and the individual bars in a group represent a search term. Hovering your mouse over the bars displays the search term and project count for the term. Using the menu To filter your results by value,
|
Document Share
The Document Share section lets you find projects that have your keywords in common. You can see how your search results relate by comparative quantity using a Venn diagram or a table.
Editing your results
To edit how project data is reported in the menu,
- click Edit at the top of the section.
- Click to select either total project count or total project value.
- Click apply selection when you are done.
The following table describes your options for refining your results using the Document Share menu.
| View | Description | ||||||
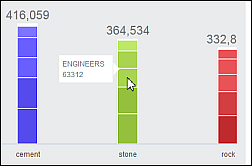
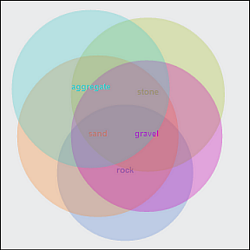
| Venn | The Venn diagram uses individual circles to show the relationship in project count between search terms
Each circle represents a separate search term and is labeled with the corresponding term and uses a specific color. The area where circles overlap indicates projects that include search terms in common. Areas with no overlap indicate that there are no terms in common. | ||||||
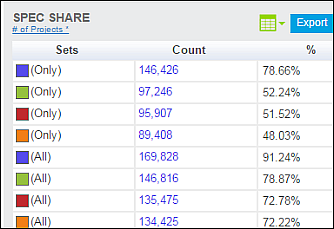
Grid | The grid view displays your results in table format:
The Sets column represents the search terms found. Each row displays the number of documents that match each of your keywords, individually and in groups. The keyword is represented by a square and is color-coded to the search terms listed at the top of the window. The Count column represents the number of times the keyword is found and the % column represents the percentage the keyword is found in relation to the total results. Menu legend
Note: Clicking on the column headers resorts the results in ascending or descending numeric order.
|
Viewing matching projects and companies
A list of the projects and companies matching your search criteria is displayed at the bottom of the window. The following sections describe the information in the list.
Using top level menu options
The following table describes the available options at the top of the menu.
| Option | Description |
Viewing projects or companies
| By default, the menu is set to show the matching projects to your search criteria. You can view the companies that match your search terms by clicking Show Matching Companies. |
Sorting by date and value
| Only available when viewing projects, click to sort the results in descending order by either the Bid Date or the Value columns. |
| Export | Click to export the list in PDF or XLS format. For information, see the section for export at the top of the page. |
| Save Search | Click to access the Save Search menu. For more information, see Searching in Analyze. |
| See All Results | Click to view the matching projects and companies in Leads. Note: You may have to adjust the pop-up blocker settings for your browser to see matching projects and companies. |
Viewing the total and comparative project values for companies
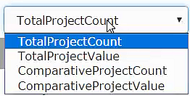
Used when viewing the results of a company comparative search, select to view the total or comparative project counts, as described in the following table.
| Selection | Description | ||||||
| TotalProjectCount | The total number of projects where the search term is specified in project documents. | ||||||
| TotalProjectValue | The total value of the product as specified in project documents. | ||||||
| ComparativeProjectCount | Only available for comparative search results with two or more companies, the total number of projects for each company. | ||||||
| ComparativeProjectValue | Only available for comparative search results with two or more companies, the total value of projects for each company.
|
Viewing matching projects and companies
The following table describes the information for the project and company listings in the menu.
| Type | Description | |
| When viewing projects | ||
| Document availability | The document icon indicates that the search has returned documents matching the search keyword.
Clicking on the icon opens Document Center to the first instance of the keyword highlighted in project documents. For more information, see Working with Document Center. | |
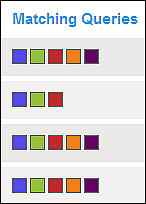
| Matching Searches | Each square indicates the search terms found in the project. The squares are color-coded to the match the colors used for the search terms shown at the top of the window:
| |
| State/Province | The state or province where the project is located. | |
| Category | The category or categories for the project (when multiple categories are found). | |
| Bid Date | The bid date for the project. | |
| Value | The value for the project. | |
| When viewing companies | ||
| Name | The name of the company. When an active link, clicking on the company name opens the details page for the company. | |
| Planning Pool | The number of projects in the Planning Stage for the company. | |
| State | The state, county or province where the company is located. | |
| County | ||
| Role Classification Parent | The parent and child role played by the company.
| |
| Role Classification | ||
| Columns listing the Individual search terms and counts | Each keyword is represented by a separate column and the numbers represent the projects where the keyword is found for the company in project documents.
Note: Depending on the search terms used, the results for an identical project search may differ between Leads and Analyze. This results from the different methods used by the two products to calculate bid packages. For more information, see the section for bid packages in the CMD Data Glossary and Best Practices. | |