...
Viewing Option | Description |
Bar chart | The bar view displays each of the selected categories grouped together by year:   |
Line chart | The line view displays the data by value and date for each category:   |
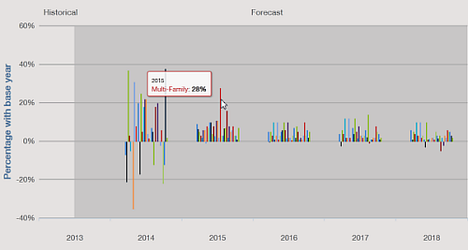
Percentage bar chart | The percentage with base year view displays the percentage change for each category from the selected base year: NOTE: The base year is selected from the Filters menu. |
...
NOTE: For more information about applying filters to the data, see Using the Filters menuMenu.
Using the Data Table
The data table is below the data graph and displays project value by year according to the options selected in the Filters menu. You can select to match project value either by category or geography, see the percentage of value change over time, and export the data in an Excel spreadsheet.
...