To open any link in a new tab, preserving your position in the current article, just hold down the <CTRL> key on your keyboard before clicking the link or click using your mouse wheel.
Reports Tab: Report Grouping
- Jacob Oveson-Davis (Deactivated)
- Daniel Wal
- Kristi Larson (Deactivated)
In your Reports, you have the ability to group your data by the column headings that are visible. The Grouping takes place in the dark grey bar at the top of the report.
![]() Watch Reports Columns and Grouping Video
Watch Reports Columns and Grouping Video
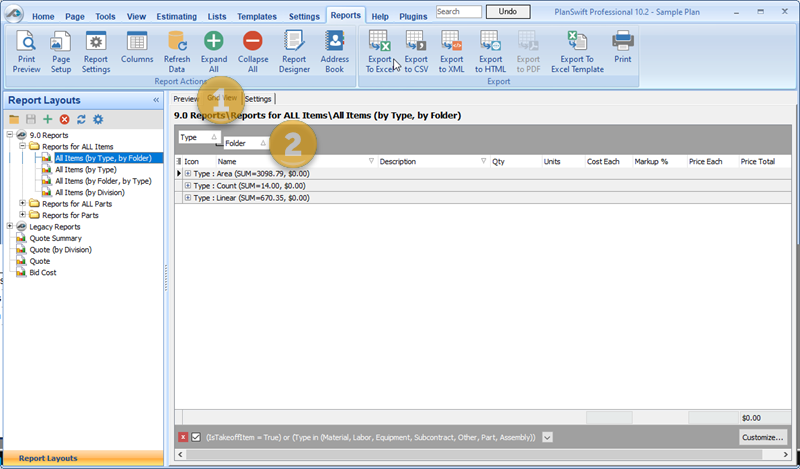
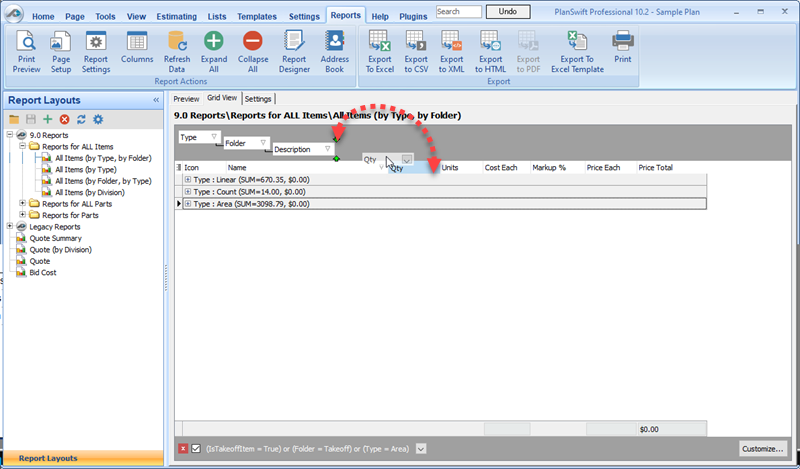
In order to group by a certain criteria, simply click and drag the column heading into the light grey bar. There is no limit to how many columns you have visible in a report. You may edit your columns by clicking on the Columns button.
To add a new column, click the Columns button, then click the green plus (+) button and type in the column name. Be sure to set the correct data type when adding your columns.
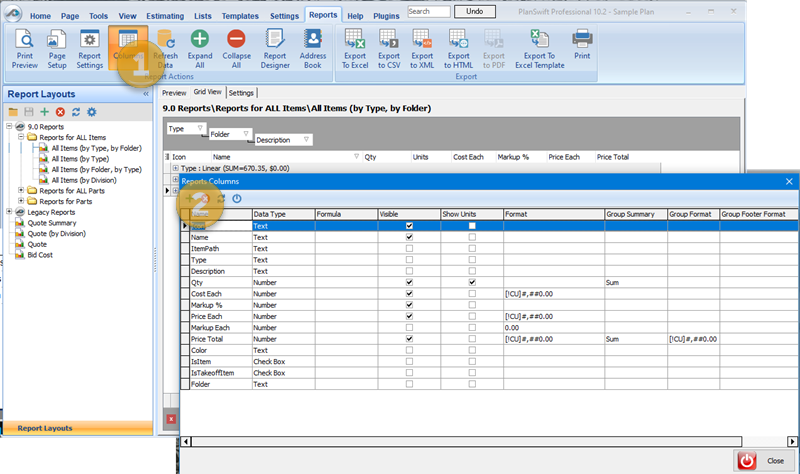
By default, each column should match a property name inside your items; this is the only way to yield a result. A formula can also be created for a column by typing it in the Report Columns window.
You can group by any column, and you may have as many groupings as you would like. Grouping is a great way to keep Reports clean and organized in order to make the data easily accessible.
Related content
Copyright 2023 ConstructConnect